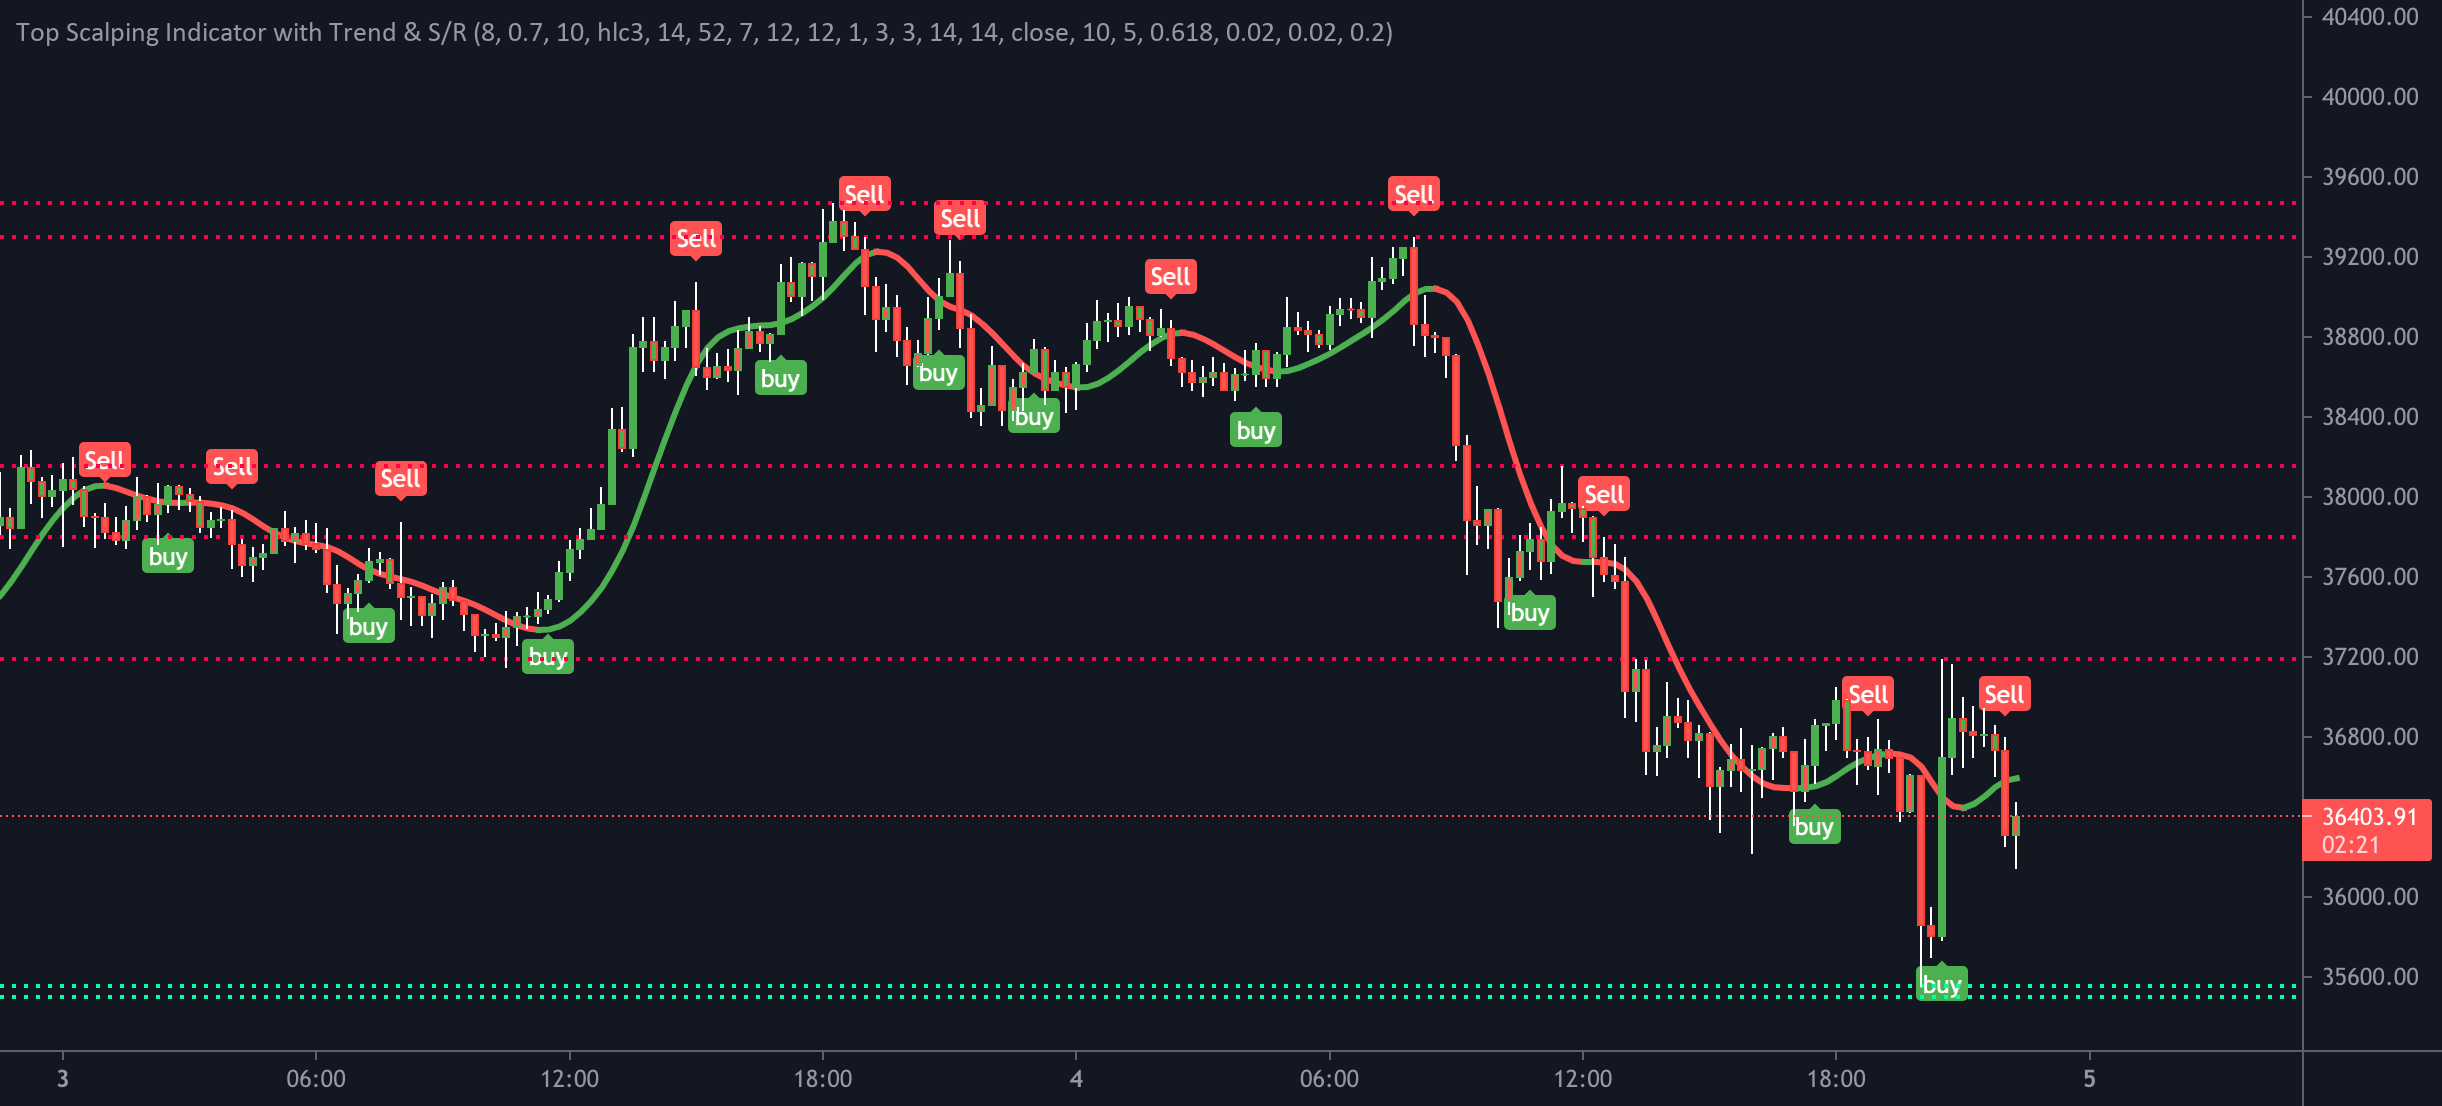
Scalping, a high-speed trading strategy, demands precision and quick decision-making. To thrive in this fast-paced environment, traders rely on specific indicators to identify optimal entry and exit points. This article delves into the most popular scalping indicators, shedding light on how they can enhance your trading success. Ready to sharpen your scalping skills? Let’s dive in! Discover the most popular scalping indicators with the help of experts connected by Quantum Bumex 2.0.
Moving Averages: The Backbone of Scalping
Moving averages are vital for scalping. They help traders spot trends quickly. The Simple Moving Average (SMA) is a basic type. It calculates the average price over a set number of periods. Traders use it to smooth out price data. This makes it easier to see the trend direction. The Exponential Moving Average (EMA) is another type. It gives more weight to recent prices. This makes it more responsive to new price changes.
Traders often use these averages to find entry and exit points. When the price crosses above the moving average, it can be a signal to buy. When it crosses below, it might be time to sell. Combining different moving averages can provide even clearer signals. For example, a short-term EMA crossing above a long-term SMA can indicate a strong buying opportunity.
Using moving averages can reduce noise in price data. This helps traders make more informed decisions. Scalping requires quick actions, and moving averages provide the necessary information at a glance. By focusing on these averages, traders can improve their chances of success. Moving averages truly form the backbone of a solid scalping strategy.
Oscillators: Timing Your Entry and Exit Points
Oscillators are essential for timing trades in scalping. They show when an asset is overbought or oversold. This helps traders decide when to enter or exit a trade. The Relative Strength Index (RSI) is a popular oscillator. It measures the speed and change of price movements. An RSI above 70 indicates overbought conditions. Below 30 means it’s oversold.
The Stochastic Oscillator is another useful tool. It compares a particular closing price to a range of its prices over a set period. Values above 80 suggest overbought conditions, while values below 20 indicate oversold conditions. These signals help traders decide the best times to trade.
Oscillators are valuable because they can highlight potential reversals. When an oscillator shows an asset is overbought, it might be about to drop. When it’s oversold, it might rise soon. This helps traders act at the right moment, maximizing their profits.
Volatility-Based Indicators for Scalping
Volatility indicators are crucial for scalping. They measure market fluctuations, helping traders understand price changes. Bollinger Bands are a popular tool. They consist of a middle band (SMA) and two outer bands. These bands adjust based on volatility. When the bands widen, volatility increases. When they narrow, it decreases.
Another key indicator is the Average True Range (ATR). It shows the average range of price movement over a set period. A high ATR indicates strong price movement, while a low ATR suggests a calmer market. This helps traders gauge the best times to trade.
Volatility indicators are vital for managing risk. In scalping, quick price changes can lead to losses. By understanding volatility, traders can set better stop-loss and take-profit points. This helps protect their investments.
Volume Indicators: Gauging Market Activity
Volume indicators are essential for understanding market activity. They show the number of shares or contracts traded. This helps traders gauge interest in a particular asset. On-Balance Volume (OBV) is a popular indicator. It adds volume on up days and subtracts it on down days. This helps traders see if volume supports the price trend.
Volume Weighted Average Price (VWAP) is another useful tool. It gives the average price weighted by volume. This helps traders see the true value of an asset. When the price is above VWAP, it indicates a bullish trend. Below VWAP suggests a bearish trend.
Volume indicators help traders confirm trends. High volume during a price increase shows strong interest. Low volume might indicate a weak trend. This helps traders decide when to enter or exit trades.
Price Action Indicators: Real-Time Market Insights
Price action indicators give real-time insights into market movements. They focus on the price itself, without relying on lagging data. Candlestick patterns are a key tool. They show price changes over a specific period. Patterns like Doji, Hammer, and Engulfing can signal potential reversals.
Trend lines are another important indicator. Drawing lines between significant highs and lows helps traders see the overall direction. Breakouts from these lines can indicate strong moves.
Price action indicators are valuable because they provide immediate information. This is crucial for scalping, where every second counts. By understanding candlestick patterns and trend lines, traders can make quick, informed decisions.
Conclusion
Mastering scalping hinges on the right tools. Moving averages, oscillators, volatility, volume, and price action indicators are crucial for navigating this fast-paced strategy. By leveraging these indicators, you can improve your trading decisions and boost your profits. Keep refining your approach and stay updated with market trends to maintain your edge in the scalping arena. Happy trading!


Be First to Comment