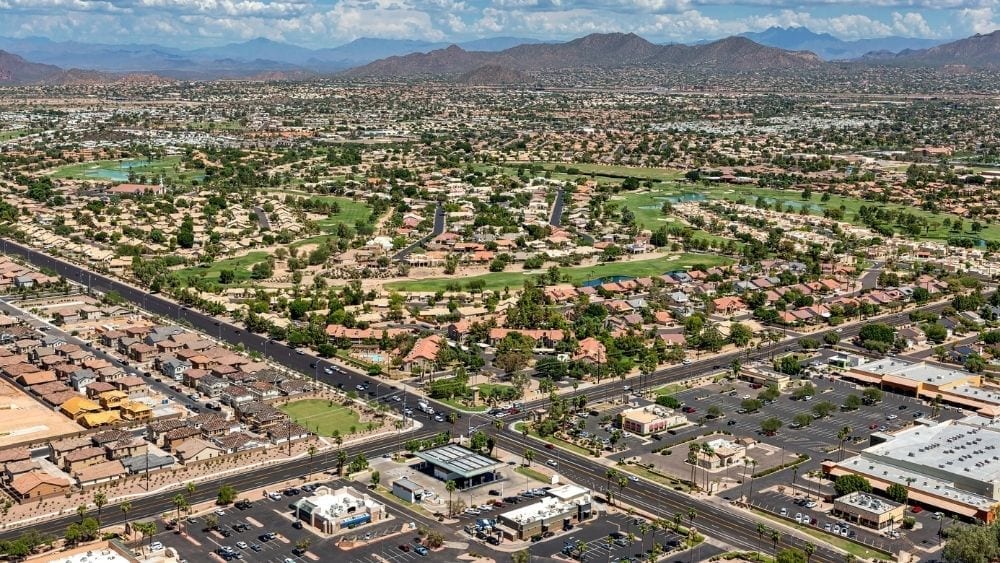
Cap rate headlines usually describe the Phoenix core: downtown towers, trophy industrial along the I-10, institutional multifamily near Tempe Town Lake. Investors who only read those headlines miss what is happening a few miles out, where East Valley submarkets like Chandler, Gilbert, and Queen Creek trade on a different set of drivers entirely. Pierce CRE works that suburban gap every day, and the firm’s read on cap rates starts with a simple premise: location sets the ceiling, but tenant quality, lease structure, and asset condition set the number a buyer will actually pay.
Pierce CRE is a commercial real estate brokerage under MHG Commercial that works Phoenix’s East Valley, handling retail and industrial deals that range from $500,000 to more than $100 million across Chandler, Tempe, Gilbert, Mesa, Scottsdale, Queen Creek, Apache Junction, and San Tan Valley. That range matters for a cap rate conversation, because a $600,000 single-tenant pad and a $40 million grocery-anchored center do not price off the same comps, even sitting in the same zip code. Investors who want to see how those numbers translate to specific East Valley addresses can review current listings and submarket notes directly through Pierce CRE, broken out by property type rather than folded into one generic feed.
“Cap rate isn’t one number for the whole valley,” says David Pierce, broker at Pierce CRE. “A single-tenant pad in Gilbert prices off different comps than a multi-tenant strip center in Mesa, even when the headline cap rate on both deals looks close on paper. Vacancy history, lease term remaining, and who is actually behind the rent roll move the number more than the address does.”
That range of formats is built into how the firm operates. Pierce CRE tracks nine property types under one desk, retail, industrial, office, multifamily, investment portfolios, land, 1031 exchange, horse property, and new development, instead of routing each deal to a different specialist. The firm’s own shorthand for that structure is blunt: every property type, one desk.
What Actually Moves a Cap Rate in the Suburbs?
In practice, three things move a suburban Phoenix cap rate more than the map does: how much term is left on the anchor tenant’s lease, whether the roof, parking lot, and mechanical systems have been touched in the last decade, and how thin the buyer pool is for that specific size and use. A well-located property with a thin buyer pool, an aging roof, or a lease rolling in eighteen months will price at a wider cap rate than a comparable asset without those flags, regardless of submarket.
Investors underwriting an East Valley deal should check, in order:
- Remaining lease term on anchor or majority tenants
- Deferred maintenance on roof, parking, and mechanical systems
- Depth of the buyer pool for that specific price band and use
- The submarket’s own vacancy trend, not the Phoenix metro average
- Whether the seller is motivated or simply testing the market
Skipping that list and comparing headline cap rates alone is the fastest way to overpay for a property that looks cheap on paper and underperforms once the anchor lease expires. Two listings on the same street can carry an identical advertised cap rate and still represent very different risk once these five items are checked against the actual lease file.
Why Do Retail and Industrial Cap Rates Diverge in the East Valley?
Retail and industrial cap rates diverge in the East Valley right now because the two sectors are working through opposite supply stories. Retail space has stayed tight, with limited new construction and quick backfill on vacancies, which keeps landlords in a stronger negotiating position and cap rates comparatively compressed on well-leased centers. Industrial has absorbed a wave of new supply delivered across 2024 and 2025, and that supply has pushed vacancy higher in submarkets that were bidding-war tight two years ago, which is widening going-in yields on commodity product even as demand from e-commerce and third-party logistics tenants stays healthy.
Nationally, CBRE’s cap rate survey projects most property types will see modest compression in 2026, roughly 5 to 15 basis points, with the sharpest gains concentrated in well-located, high-quality assets rather than commodity product. Separately, commercial market data tracked by NAR shows Sun Belt metros, Phoenix included, absorbing that same new-supply wave, which is exactly why an industrial building’s vintage and clear height now matter as much as its address.
- Retail (East Valley): Population and rooftop growth, pad and quick-service demand; Tight, limited new construction, fast backfill; Private investors, 1031 exchange buyers
- Industrial: E-commerce and 3PL distribution, small-bay incubator space; Elevated from 2024 to 2025 supply, vacancy rising in some submarkets; Institutional and regional investors, owner-users
- Multifamily: Household formation, continued in-migration to the East Valley; A favored sector in CBRE’s 2026 outlook; Institutional capital, syndicators
- Office and Medical: Medical and professional tenant demand, limited speculative building; Stable to tight in medical-anchored product; Local investors, owner-users
Is Suburban Phoenix Still a Buyer’s Market for Industrial Right Now?
For well-capitalized buyers, yes, because rising vacancy from new supply is giving investors more negotiating room than the tight, multiple-offer conditions of 2021 and 2022. That does not mean every industrial listing is a bargain. Smaller bay product in the 1,500 to 5,000 square foot range tends to lease and reprice faster than large bulk boxes, so the supply glut is hitting different size bands unevenly, and pricing should reflect the specific size and clear height, not a metro-wide industrial narrative. Buyers who treat all Phoenix industrial as one asset class, rather than pricing small-bay and large-bay product separately, are the ones most likely to misjudge where a fair cap rate sits in 2026.
None of this replaces submarket-specific underwriting, but it explains why two East Valley properties with similar headline cap rates can carry very different risk. Investors comparing retail, industrial, or any of the other property types Pierce CRE tracks across Chandler, Gilbert, Tempe, Mesa, and Scottsdale are better served comparing lease term, tenant quality, and local supply trend first, and treating the cap rate number as the last input rather than the first.




Be First to Comment